Assessing India’s Free Trade Agreements

Almost two decades back, India began its serious engagements with bilateral and regional free trade agreements (FTAs) with the adoption of the Framework Agreement on Comprehensive Economic Cooperation with the Association of Southeast Asian Nations (ASEAN) in 2003. This agreement was the articulation of the decision taken by the Trade Ministers of India and ASEAN in 2002 to work towards a Bilateral Regional Trade and Investment Agreement (RTIA). India and ASEAN entered into negotiations for establishing the RTIA that would include a free trade area in goods, services and investment, to be achieved through, inter alia progressive elimination of tariffs and non-tariff barriers in substantially all trade in goods; progressive liberalisation of trade in services with substantial sectoral coverage; and establishment of a liberal and competitive investment regime that facilitates and promotes investment within the India-ASEAN RTIA (emphasis added) (ASEAN 2003).
The two parties had initially decided to conduct the negotiations in two phases: negotiations for liberalising trade in goods were planned between January 2004 and end of June 2005, while negotiations opening up trade in services and investments would be conducted between 2005 and 2007. However, the ASEAN-India FTA in goods were signed only in 2009, while the services and investment agreements were endorsed in 2014.
The ASEAN-India Framework Agreement was a watershed moment in India’s trade policy making as the Government of India made a turnaround from its earlier stance on FTAs, which can best be described as one of hesitancy, bordering on suspicion. Prior to the agreement with the ASEAN, India had entered into only two preferential trade agreements (PTAs) and a solitary free trade agreement (FTA) covering the goods sector. The first of the PTAs was the Bangkok Agreement (now known as the Asia Pacific Trade Agreement) in 1975[1] and the second was the SAARC Preferential Trade Agreement (SAPTA) between the seven founding members of the grouping in 1995. India concluded its first free trade agreement (FTA) with Sri Lanka in 1998 (Ministry of Commerce and Industry 2022a). These agreements were relatively shallow, implying trade liberalisation undertaken through these agreements were modest.
India, traditionally a supporter of the multilateral trading system, seemed wary of FTAs until the early 2000s. This was reflected in its Discussion Paper on Regional Trading Agreements tabled at the World Trade Organization (WTO) in 2003, which stated thus: “Though RTAs are an alternative window of trade liberalisation as well as an alternative framework of development between more limited sets of countries or economies, it is important that they complement multilateral trade liberalisation and not create complications for that goal or occur at the cost of trade or development of countries not members of particular RTAs” (WTO 2003: paragraph 2).
However, with the commencement of negotiations for the ASEAN-India FTA (AIFTA) in 2004 India quickly changed its earlier stance. Decisions were soon taken to negotiate FTAs[2] with Singapore, the Republic of Korea (RoK), the European Union (EU), Japan and Malaysia. Besides, an expedited deal with Thailand, an “Early Harvest Programme”, was also concluded in 2004. This was the first substantive phase of India’s engagements with FTAs, which concluded in 2011. During this phase, five FTAs, with Singapore, the ASEAN, RoK, Japan, and Malaysia were adopted. However, one important FTA, with the EU member states could not be finalised “due to a gap in ambition” (European Commission 2022).
The second phase of India’s global economic integration via FTAs overlaps the first, and it begins with the launch of trade negotiations with Canada and New Zealand in 2010, followed by Australia. In this phase, the most significant decision was to join the negotiations for adopting the Regional Comprehensive Economic Partnership (RCEP), a grouping of the ASEAN and its six countries FTA partners[3]. However, India’s engagement with RCEP ended abruptly in 2019 when Prime Minister, Modi announced India’s decision to withdraw from negotiations (Laskar 2019). By withdrawing from RCEP, the Government had explicitly signalled that India was stepping back from the bilateral trade and investment agreements. The Atmanirbhar Bharat Abhiyan announced in 2020 seemed to confirm that India was agnostic about FTAs.
By the second half of 2021, the government had shrugged off its scepticism regarding FTAs, triggering the third phase of India’s FTA-engagements. The Commerce Minister announced that there was a “very positive momentum in terms of FTAs, with the United Kingdom (UK), EU, Australia, Canada, United Arab Emirates (UAE), Israel and the Gulf Cooperation Countries (GCC) countries” and that “Early Harvest Agreements with UK and Australia” would be concluded (Ministry of Commerce 2021a). By end-2021, the Government announced that India was negotiating FTAs with 7 countries/groupings, namely, the UAE, Israel, the UK, the EU, Canada, Australia, and the Eurasian Economic Union, which includes the Russian Federation, Armenia, Belarus, Kazakhstan, and Kyrgyzstan (Ministry of Commerce 2021b). In the first half of 2022, the India-UAE CEPA was finalised as was the Australia-India Economic Cooperation and Trade Agreement (ECTA), which is the first phase the Australia-India CEPA.
This paper discusses India’s participation in FTAs during the three phases described above and assesses the outcomes of these agreements in respect of trade in goods. A similar exercise should have been undertaken for services trade as well, but this was not possible in the absence of comparable bilateral data on services trade.
The first section of the paper discusses the FTAs with the ASEAN members, the RoK, and Japan. These agreements were endorsed with the expectations that the Indian businesses would improve their presence in the partners’ markets that they would increase their participation in the production networks spawning in India’s eastern neighbourhood. The outcome of these FTAs would be evaluated in this section. The second section deals with India’s participation in the negotiations for adopting the RECP and analyses the reasons contributing to its withdrawal. The third section discusses the trade liberalisation initiatives undertaken in the FTAs with UAE and Australia, and their likely outcomes.
I. India’s FTAs with the ASEAN, Republic of Korea, and Japan: Trade liberalisation and outcomes
The discussion in this section will first highlight the trade liberalisation undertaken via the three agreements. Subsequently, changing nature of goods trade following the implementation of the CEPAs would be analysed to understand if the objectives of the agreements have been realised.
(i) Tariff reduction under the Agreements
We will first highlight the key elements of tariff elimination of goods undertaken by analysing schedules of commitments of India and its partners.
(a) India-ASEAN FTA (AIFTA)
In fulfilment of the objectives of the Framework Agreement, India and ASEAN entered into negotiations to establish an India-ASEAN RTIA, to be realised, among other things, through progressive elimination of tariffs (Ministry of Commerce and Industry 2009). Towards this end, negotiations on market access were conducted keeping in view the sensitivities of the ASEAN members, namely, the interests of then lesser developed countries, namely, Cambodia, Myanmar, Laos and Viet Nam (CMLV) by giving them longer periods for reduction or elimination of tariffs. However, India’s regional sensitivities were not fully get reflected in its commitments; reductions in tariffs on pepper was a case in point (Ajayan 2009).
Market access commitments of ASEAN members and India are captured in Annex Table 1. The table shows that India eliminated tariffs on 74% of its total tariff lines on imports from all ASEAN members, barring the CMLV, by 2019, but tariff elimination commitments of most ASEAN members were less than those of India. For instance, Indonesia eliminated tariffs on less than 47% of its tariff lines.
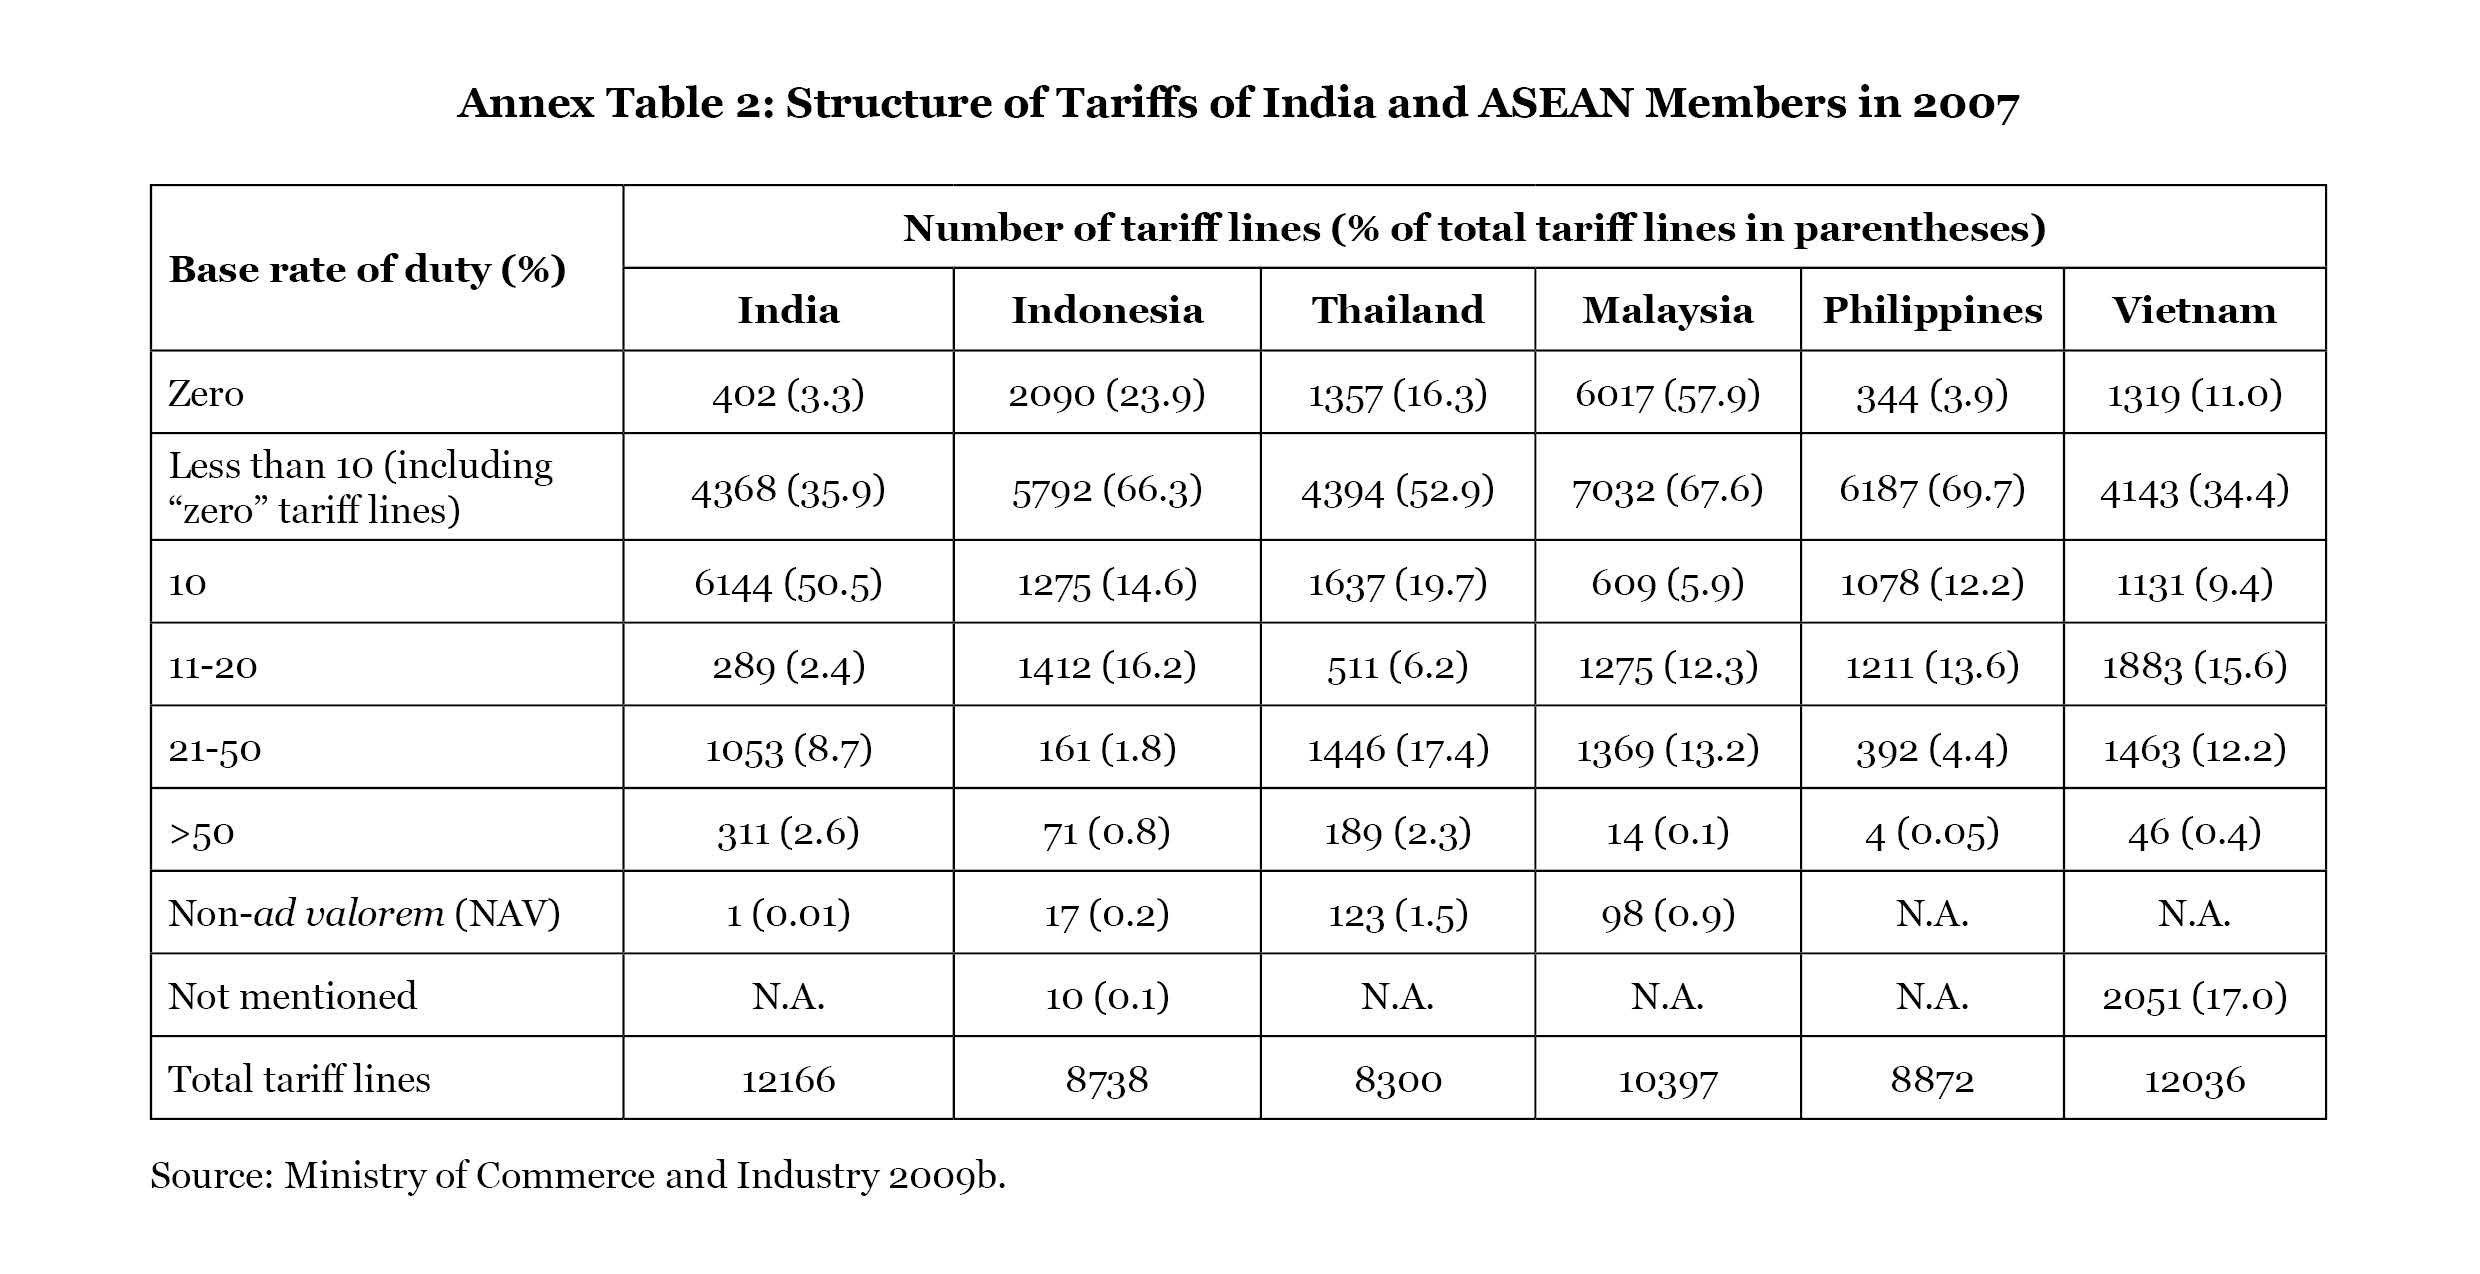
Another important aspect of tariff liberalisation under AIFTA was that India had lowered its level of protection by a higher magnitude in comparison with the major economies in the ASEAN region. Under the agreement, tariffs were lowered from the level at which they were in 2007 (“base year”). Comparison of tariff structures in the “base year” (Annex Table 2) show that the level of tariff protection provided by India was the highest. It had the lowest share of tariffs below 10%, including tariff-free lines and the highest share of high tariffs, namely, tariffs above 50%. This implies that as a result of its tariff concessions granted under AIFTA, India had reduced its level of protection substantially more than the larger economies in the ASEAN region.
(b) India-Korea CEPA (INDKOR-CEPA)
The key objective of INDKOR-CEPA was to “liberalise and facilitate trade in goods” and to “establish a cooperative framework for strengthening and enhancing the economic relations between the parties”. Tariff reductions negotiated under the agreement are discussed below.
India eliminated tariffs on nearly 69.6% of its tariff lines upon full implementation of the agreement, or the beginning of the seventh year of the implementation of the agreement (January 1, 2017). India’s commitments were “back-loaded” as it had eliminated tariffs on nearly 62% of the tariff lines only in the last year of implementation. Further, India had included more than 16% of the tariff lines in the exclusion (from reduction of tariffs) list and had reduced tariffs on 14% of tariff lines (Annex Table 3)
India eliminated tariffs in a large proportion of tariff lines in several major manufacturing sectors, including base metals and chemicals. But tariffs on three-fourths of the tariff lines in the automobile sector were left unchanged. India did not eliminate tariffs in any of the agricultural products; in almost 40% of the agricultural tariff lines, tariffs remained unchanged.
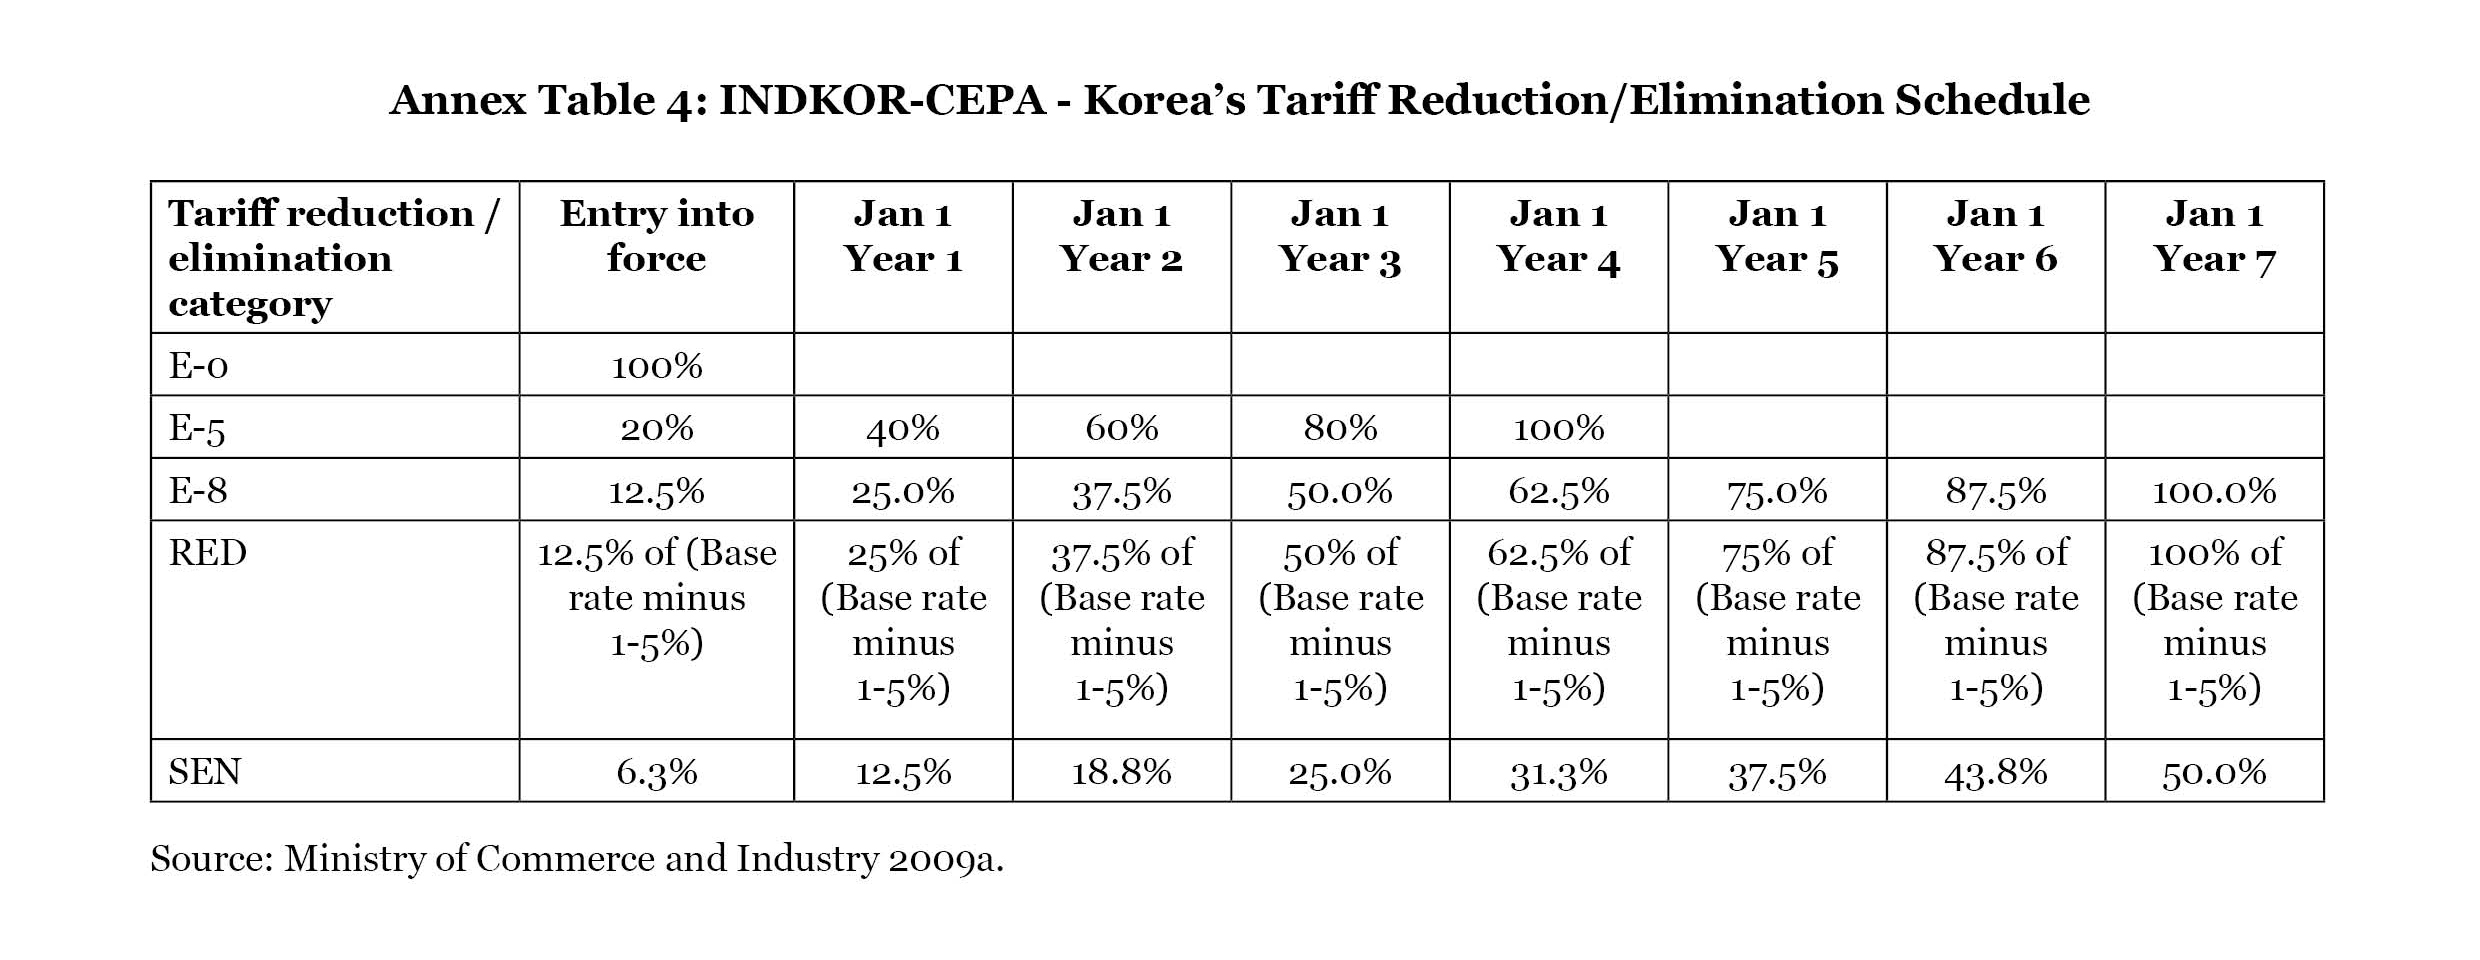
Korea’s tariff offers were significantly different from those of India’s, in terms of both the depth and the time-phasing of tariff cuts. Korea had offered to eliminate tariffs on 88.6% of its tariff lines upon full implementation of the CEPA. More than 60% of tariff lines were made tariff-free upon the entry into force of the agreement. Further, only 7% of Korea’s tariff lines were in the exclusion list (Annex Table 4). However, as in the case of AIFTA, the higher level of tariff protection provided by India in 2006, considered as the base period for reducing/eliminating tariffs, meant that tariff liberalisation that India had undertaken was more extensive as compared to its partner (Annex Table 5).
(c) India-Japan CEPA
Formalised in 2011, the India-Japan CEPA (INDJAP-CEPA) recognised that “economic partnership will create larger and new market, enhance the attractiveness and vibrancy of their markets, and contribute to improving efficiency and competitiveness of their manufacturing and service industries”. As compared to the AIFTA and INDKOR-CEPA, tariff elimination that India undertook under INDJAP-CEPA was the highest. Upon full implementation of the agreement, India eliminated tariffs on 86.4% of its tariff lines (Annex Table 6). India backloaded its tariff elimination schedule: tariffs on more than 63% of the tariff lines were eliminated only in the 11th year of implementation of the agreement (1 January 2022).
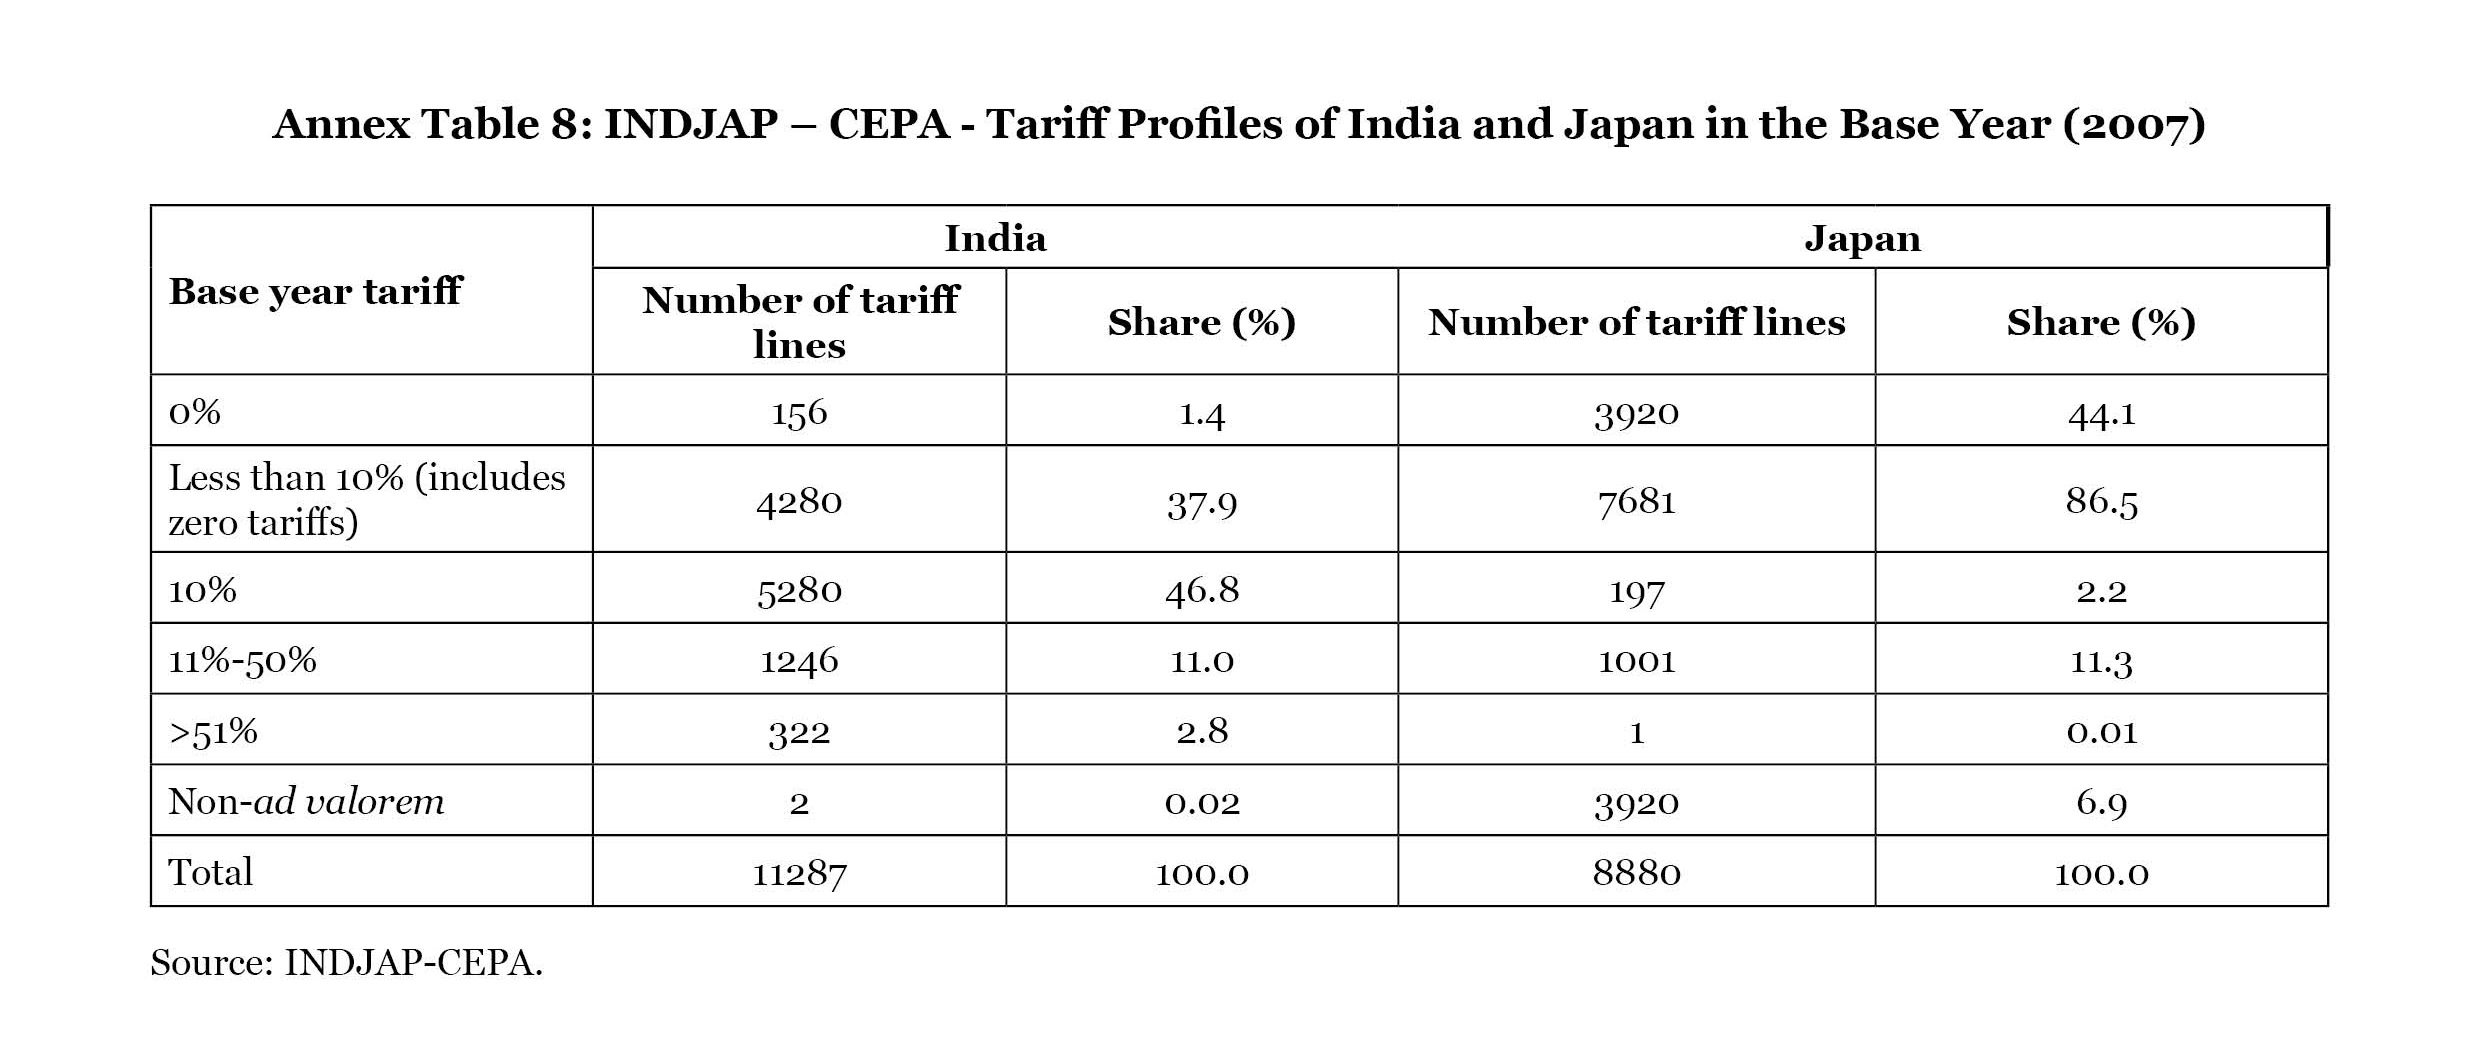
Annex Table 8 shows the tariff profiles of India and Japan in 2007, the base year for reduction/elimination of tariffs under INDJAP-CEPA. In the base year, tariff lines with tariffs of below 10% had a share of less than 40%, but by undertaking tariff cuts under this agreement, India had eliminated tariffs on over 86% of its tariff lines. But as in case of the two other agreements, India’s dropped its tariff protection levels far steeply than its partner country/countries.
An interesting facet of India’s tariff cuts can be seen by comparing the tariffs in the base year and the scheduling of tariff cuts. Of the 7,162 tariff lines whose tariffs were eliminated at the beginning of 2022, 3,856 tariff lines, or about 54%, had base year tariffs of 10% or more[4]. Further, of the 1,538 tariff lines which were excluded from tariff cuts, 442 tariff lines, or almost 29%, had base year tariffs of less than 10%. This shows that tariffs were eliminated on tariff lines that had attracted moderate to high levels of tariff protection during the base year, while a sizeable share of tariff lines that had low levels of protection were excluded from tariff cuts. In other words, there was some disconnect between unilateral tariff liberalisation adopted by the Government of India and the pattern of tariff protection in the INDJAP-CEPA.
The above discussion makes it quite clear that India undertook ambitious tariff cuts under all the three agreements, and in doing so, the policy makers had accepted the argument that gains from trade would accrue by merely adopting an open trading regime. Expectations were that as the partners of these agreements open their markets, Indian businesses would increase their footprints in these markets. The next section discusses as to how far these expectations were realised.
(ii) Outcomes of the FTAs with the ASEAN, the RoK, and Japan
In this section, we will present the data for levels and patterns of trade between that has evolved since these agreements were implemented. Since all the three agreements have been fully implemented, this exercise analyses what these agreements have delivered in the realm of trade in goods, post-implementation.
(a) ASEAN-India FTA
Historically, India has been a minor player in ASEAN markets and this situation remained unchanged despite the initiatives taken under the AIFTA to strengthen their trade relations. In 2003, when India and the ASEAN adopted the Framework Agreement, India’s share was only 1.7% of ASEAN’s global trade. Although this share rose to 3.1% in 2011, immediately after commencement of implementation of the agreement, in the subsequent period, India’s share in the ASEAN market fell, and was 2.7% in 2021[5]. ASEAN’s importance as India’s trade partner has changed marginally; the share of the grouping in India’s total trade rose from 9% in 2004-05 to 10.7% in 2021-22.
Figure 1 shows the trends of India’s merchandise trade with the ASEAN. In 2004-05, India had a marginal trade deficit with the ASEAN, which increased rapidly after the AIFTA was signed. During the implementation of the agreement, the trade balance had almost consistently increased to reach almost US$26 billion in 2021-22. This was on account of the lack of thrust of India’s exports coupled with the ASEAN members’ higher degree of penetration into the Indian market. In fact, even in 2021-22, when India’s exports had scaled the historically high level of $421 billion, India’s export growth in the ASEAN was 34% as against the expansion of ASEAN imports to India of 43.5%.
Figure 1 shows that India’s trade imbalance worsened significantly between 2017-18 and 2018-19, increasing from below $13 billion to nearly $22 billion. The main contributory factor was that the trade surplus of $2.7 billion vis-à-vis Singapore turned into a deficit of $4.7 billion. This was a consequence of a steep increase in India’s imports of electrical and non-electrical machinery as well as coal, petroleum, and gas from the city state. The source of the sudden increase in exports raises the question of circumvention of trade, or the use by third parties of the lower tariffs that imports from Singapore enjoy in India due to the tariff preferences extended through the AIFTA as also the bilateral trade agreement between India and Singapore. The Government of India responded to such possibilities of misuse of preferences by strengthening the provisions on rules of origin through the Customs (Administration of Rules of Origin under Trade Agreements) Rules, 2020.
The more important aspect is the commodity composition of its exports, for this provides a clue about India’s position in the international division of labour. This shows a mixed picture: on the one hand, the share of raw materials and intermediates in India’s export basket to the ASEAN is still quite substantial, but on the other, the share of high technology products have gone up during the implementation of AIFTA.
In 2010-11, the top 25 products (at HS 4-digit level) accounted for nearly 71% of the India’s total exports to the ASEAN. 13 of these products were either raw materials or intermediaries and had accounted for nearly 52% of the total exports. In 2021-22, the commodity composition had not changed significantly. The top 25 products had accounted for 62.5% of the total exports, with raw materials or intermediaries accounting for over 48%. Sectors producing relatively high technology[6] products had a share of nearly 12% in India’s exports in 2009-10, in 2021-22, these sectors’ share had increased to nearly 19%.
India’s imports from the ASEAN have been dominated by edible oil, coal, petroleum, and gas. In 2009-10, the share of these products was over 40%, but had declined to 32% in 2021-22. The share of high-tech products in India’s imports from the ASEAN was 21% in 2010-11, and this had increased to over 26% in 2021-22.
India’s inability to take advantage of the trade opening created by the AIFTA and, consequently, its inability to increase its presence in the South East Asian region remains the most contentious aspect of the agreement. The Government of India has frequently spoken about the need to review the agreement, but there have yet not been any concrete steps towards initiating the process of review.
(b) India-Korea CEPA
India continued to be a relatively small trade partner of RoK even after a decade of implementation of the INDKOR-CEPA. In 2010, India’s share in RoK’s global trade was 1.5%, a decade later, it was 1.9%[7]. RoK’s share in India’s global trade followed a similar pattern, increasing marginally from 2.3% in 2010-11 to 2.5% in 2021-22[8]. In other words, the political push towards increasing the bilateral trade relations through the CEPA did not help in realising the desired outcomes, well into the implementation period of the CEPA.
The trends in India-Korea merchandise trade since the implementation of the CEPA are provided in Figure 2. The pattern seen in India’s trade with several ASEAN countries repeated itself in India’s trade with Korea, namely, India’s inability to penetrate the Korean market together with the increasing presence of Korea in India’s market.
Raw materials and intermediates were India’s major exports to RoK when the INDKOR-CEPA was signed, and situation remained unchanged. Of the top 25 products exported from India, accounting for 76% of India’s total exports in 2021-22, 74% were raw materials and intermediaries. This was largely due to the high share of petroleum products, over a third of the total exports in most years. This was also the factor that led to the lowering of the trade deficit during 2021-22. Perhaps expectedly, high tech products had a nominal share, remaining consistently below 10% of total exports.
Interestingly, intermediate products had a sizeable share in India’s imports from RoK, well over one-half of the top 25 products, whose share remained uniformly above 50% of total imports. This high share of intermediates could be a sign of India’s growing presence in the value chains being managed by Korean companies. Over a longer period, this could be an important trigger for India’s export growth, not just to RoK but to other countries as well. High tech products had a prominent place in India’s import basket, often having a share of well above a third. The important question here is whether the Indian companies can benefit from technology spill overs arising from the operation of Korean businesses in India.
(c) India-Japan CEPA
One of the key objectives of the INDJAP-CEPA was to open new vistas of economic engagement between the two countries through enhanced levels of trade and investment. However, contrary to the expectations of the two governments, to increase bilateral trade flows, Japan’s importance as India’s trade partner has declined during the period of implementation of the agreement from 2.3% of India’s total trade in 2011-12 to 2.0% in 2021-22. On the other hand, India’s share in Japan’s total trade remained unchanged during this period, according to the Japan External Trade Organization (JETRO 2022).
The trends in India’s merchandise trade with Japan are captured in Figure 3. Immediately after the signing of the INDJAP-CEPA, India’s exports had increased, and together with a fall in imports from Japan, there was a sharp fall in India’s trade imbalance in 2013-14. However, an abrupt drop in India’s exports thereafter raised serious questions regarding utilisation of the CEPA to India’s advantage. Although exports rose to in subsequent years, especially during 2021-22, the level at which they were in 2013-14, from where the decline had begun, was not reached. But while India’s imports had dropped, its imports from Japan consistently increased, barring the break in this trend due to the economic downturn during 2020. By 2021-22, the trade imbalance in India-Japan trade was at a historically high level of $8.2 billion.
The commodity composition of India’s exports to Japan is assessed by considering the top 25 commodities, which accounted for nearly 80% of the total exports in the first year of implementation of the INDJAP-CEPA (2011-12) but had dropped to 54% in 2021-22. Almost 75% of the exports in 2011-12 were raw materials and intermediates, an indication that, like in the AIFTA and INDKOR-CEPA, its trade agreement with Japan was not delivering optimal benefits. However, by 2021-22, these indicators became relatively more favourable for India, as the top-25 commodities accounted for 54% of total exports, and raw materials and intermediates among these top-25 commodities had a much-reduced share 36% share in total exports.
In contrast, India’s imports had a much smaller share of raw materials and intermediates. Of the top-25 commodities that had accounted for nearly 50% of total exports in 2021-22, raw materials and intermediates accounted for less than half of these. Unsurprisingly, high tech products had a large share in Japan’s exports to India (45%). Contrast this with India’s exports of high-tech products to Japan, which were less than 20% of the total.
The patterns of merchandise trade during the implementation of India’s three CEPAs with the ASEAN, RoK and Japan bring out a number of problems that were highlighted in the foregoing discussion. India had entered into these agreements expecting to increase its presence in the economically most dynamic region of the world. A more important expectation of India was to leverage these agreements to participate more actively in the regional value chains, which would have, in turn, helped in developing a globally competitive manufacturing sector. The lack of a vibrant manufacturing sector had stymied the development of the Indian economy, and once this constraint was removed, creation of decent jobs could then be possible.
This inability to secure adequate benefits from the three CEPAs had a much larger impact; the process of India’s global economic integration became increasingly difficult. This became apparent when India began participating in the negotiations for framing the RCEP, East Asia’s Mega Regional Trade Agreement.
The next section would include a discussion of this second phase of India’s engagement with FTAs.
II. India’s RCEP Misadventure
There are at least three reasons why India’s decision to engage in the negotiations for the formation of RCEP, may not have been the most appropriate. The first was that during the implementation of the ASEAN, the RoK, and Japan FTAs, questions were being asked about their benefits for India. The major reason was the growing trade imbalances discussed earlier.
Secondly, the “Guiding Principles of RCEP”, the de facto negotiating mandate stated that “RCEP will aim at progressively eliminating tariff and non-tariff barriers on substantially all trade” and that tariff “negotiations should aim to achieve the high level of tariff liberalization”. The wording of the negotiating mandate, which India had agreed comply with while accepting to join RCEP negotiations in 2013, would have left little scope for maintaining a regime for protecting its domestic vulnerabilities, in agriculture and several manufacturing sectors. The RCEP negotiating mandate was, therefore, in stark contrast to the template of import protection that was an almost settled issue in India.
And, finally, the “China factor”, namely, the rapidly increasing footprint of India’s northern neighbour that was an issue of consternation. The question was that when China’s imports could expand so rapidly when “most favoured nation” tariffs[9] were applied on its products, what would be the consequences for Indian manufacturing industries when preferential tariffs are applied on these products.
The contrast between India’s and RCEP Members’ use of tariff protection is evident from the following table.
India’s average tariff rate in 2019 (17.6%) was the highest among RCEP participating countries (RPCs). India also had the least number of duty-free tariff lines covering both agricultural and non-agricultural products.
India’s agricultural tariffs have historically been higher, and this was true also in 2018, when average tariff rate (38.8%) was substantially above those imposed by all larger RPCs, except RoK. Average tariffs on non-agricultural products for India were 14.1%, the only country among the major RPCs whose average tariffs was in double digits.
The more problematic aspect for India was that while RPCs were negotiating tariff cuts, India’s average tariffs ratcheted up from 13.5% in 2013 to 17.6% in 2019, which was due to increases in the average tariffs on agricultural products from 33.5% to 38.8% and non-agricultural products, from 10.2% to 14.1%. These tariff hikes were the first time in recent decades that the government had reversed its policy of progressive tariff liberalisation, by responding to the demands of several manufacturing sectors for increasing import tariffs, which, for several sectors, were raised by at least 50%. The government argued that tariff hikes were undertaken “incentivise the domestic value addition and Make in India”[10] and “in order to provide domestic industry a level playing field”[11].
Finally, sectors like the automobiles demanded continuation of high tariff protection. The position of the Society of Indian Automobile Manufacturers (SIAM) was that “FTAs with competing countries do not benefit Indian automobile industry, it is against the concept of Make in India for local value addition and local employment, and hence CBUs of vehicles and engines should be kept in India’s Negative List”[12] of any FTA that India negotiates.
In agriculture, India’s average tariffs have never decreased below 30%. Such levels of tariffs have been primarily driven by the fact that 85% of the farm holdings are small and marginal (less than 2 hectares), of which 67% of the holdings are one hectare or less[13]. The government had little choice but to impose high levels of tariffs to protect rural livelihoods. Under such circumstances, imports triggered by sagging global prices could destabilise domestic markets[14]. The government could not possibly give up this policy space by lowering import duties on major agricultural commodities by reducing tariffs.
In an early phase of the market access negotiations, India proposed a 3-tier tariff reduction/elimination offer, the broad contours of which are indicated below (Ministry of Commerce & Industry 2015):
- Tier 1 – for ASEAN Members: Eliminating tariffs on 80% of the tariff lines.
- Tier 2 – for Japan and Korea: Eliminating tariffs on 65%.
- Tier 3 – for China: Eliminating tariffs on 42.5% of tariff lines; for New Zealand: Eliminating tariffs on 65% of tariff lines; for Australia: Eliminating tariffs on 80% of tariff lines.
For each Tier, tariff elimination was proposed over a 10-year period.
The above-mentioned tariff offers reflected India’s domestic sensitivities. For instance, the detailed tariff offers showed that India wanted to maintain high levels of protection for agricultural products. Further, by offering China only 42.5% of zero tariff lines, India sought to convey a message that India was reluctant to provide sufficient tariff preferences to its northern neighbour for reasons discussed below (Dhar 2019).
Offering preferential tariffs to China was not acceptable to the Indian manufacturing sector, for China was marginalising them by aggressively exporting cheap products to India. Consequently, India’s imports from China had increased from less than $11 billion in 2007-08 to $76 billion in 2017-18. Though Chinese imports was marginally lower in 2018-19, there remained the possibility of further increase in the subsequent years, which became a reality. It was obvious that the “China factor” could become a determining factor in India’s pulling out of RCEP (Ghosh 2019).
India-China trade over the past two decades is shown in Figure 4. The combination of rising Chinese imports into India and an almost stagnant trend in India’s exports to China after 2012-13, resulted in steadily increasing trade deficit, which, in 2021-22 was at the record level of $73 billion. The imbalance in India-China trade was 47% of India’s overall trade balance in 2016-17, and although this figure had declined in the more recent years, it continues to be around 40%.
The above-mentioned numbers do not provide the true picture of India’s dependence on China; imports at product level do[15]. There are two major sectors in which India’s dependence on China is particularly high, electronic products, including telecommunication equipment and active pharmaceutical ingredients (APIs). Both these sectors are immensely significant for India. While the former sector is the critical for Government of India’s Digital India programme, the latter supports India’s pharmaceutical industry that supplies affordable medicines, to the domestic market and several countries in both developed and developed world.
In 2017-18, more than 90 per cent of India’s imports of mobile phones and components were sourced from China. Import data show that in the following two financial years, imports from China came down significantly, but the reality is that Hong Kong is acting as a conduit for China’s exports to India. In 2017-18, India’s imports from Hong Kong were nearly $11 billion, but the following year it increased to over $18 billion.
The syndrome of dependence on China is even worse in case of APIs. Among the medicines whose APIs are imported is Paracetamol, an essential medicine in the first aid kit of every household. In 2018-19, the entire stock of imports of this medicine came from China. Similar was the case of Streptomycin, an antibiotic used for treating several bacterial infections, including tuberculosis. Besides these medicines, China was the source of 95 per cent of imports of APIs for penicillin and 98 per cent of Ibuprofen, a common medicine used for treating pain, fever and inflammation of various kinds, including arthritis. APIs of many other critical medicines are also sourced from China.
That the government’s decision to withdraw from RCEP was intended to be the first step to limit China’s growing presence in the Indian economy, became clear after production linked incentive (PLI) scheme was announced. The PLI scheme prioritises the strengthening of domestic enterprises in several industries, including those that have faced competitive pressures from China. And, finally, in the wake of the COVID-induced economic downturn, the government had announced the “Atma Nirbhar Bharat Abhiyan”, whose cornerstone was the slogan, “vocal for local”. The government seemed to have, thus, spoken its mind about its withdrawal from RCEP.
III. India’s renewed engagements with bilateral FTAs
From the last quarter of 2021, India’s external sector engagements have looked distinctly different from where they were since the decision to withdraw from the RCEP. As the Indian economy was emerging from the downturn, the government’s narrative on FTAs changed quite dramatically. The scepticism towards bilateral economic partnership agreements was all but passé, as the government was engaged in negotiating 7 economic partnership agreements, which included the long-stalled negotiations with the European Union (EU), Australia, Canada, and Israel. India also initiated negotiations with the United Arab Emirates (UAE), the United Kingdom (UK) and Eurasian Economic Union. Besides, India has also revived negotiations for a preferential trade agreement with the Southern African Customs Union (Ministry of Commerce 2021).
In early 2022, India and the UAE concluded the CEPA, an agreement that has several firsts for India. The India-UAE CEPA was the first bilateral trade agreement (Ministry of Commerce 2022a) that India had endorsed in over a decade, after the India-Japan CEPA was signed in 2011. Secondly, the agreement covers the widest possible array of subjects and includes areas like the digital economy and government procurement, which have never been included in any of the bilateral trade agreement that India has negotiated thus far. And, finally, India undertook extensive tariff cuts, significantly more than any of the previous FTAs.
In April 2022, India and Australia signed the Economic Cooperation and Trade Agreement (ECTA), an “early harvest agreement”, intended to be the first step towards a Comprehensive Economic Cooperation Agreement (CECA). Agreement on a trade deal between the two countries has been long coming, with the negotiations were stalled since 2015.
The following is a brief discussion of the two newly concluded agreements.
(i) India-UAE CEPA
As mentioned above, India has provided extensive market access opportunities to products imported from the UAE. On May 1, when the CEPA became effective, India eliminated tariffs on about 65% of its tariff lines (Ministry of Commerce and Industry 2022c). Within the next decade, another 20% of India’s tariff lines will be duty free. In addition, tariffs will be lowered on more than 5.5% of tariff lines. Thus, within a decade, import duties will either be zero or will be lower than those existing currently on more than 90% of India’s tariff lines. Unlike in the other agreements, India is undertaking significant lowering of tariffs in agriculture and allied sectors, keeping only 17% of tariff lines in the exclusion (from tariff cuts) list. Similarly, a mere 6% of tariff lines in electrical and non-electrical machinery are in the exclusion list. In contrast, around 50% of tariffs lines in plastics and automobiles excluded from tariff cuts.
The Government of India is quite upbeat about India’s market access prospects in the UAE (Ministry of Commerce and Industry 2022b). This is because UAE has eliminated tariffs on over 97% of its tariff lines, corresponding to 90% of India’s exports in value terms the day the Agreement became effective. Within the next 5-10 years, 99% of India’s exports in value terms will attract no duty in the UAE.
Trade between the two countries could be strengthened further as India had decided to include the area of government procurement in the CEPA. However, India’s offers in this area are subjected to a number of conditions, which include: (i) procurement by entities shall not be higher than SDR 2 million; (ii) the agreement would not apply to departments and attached bodies, autonomous bodies, government owned companies, public sector enterprises, regulators or any other entities; (iii) procurements related to construction projects or any infrastructure projects; (iv) procurements relating to health care sector including medical devices, pharmaceutical products, therapeutics, diagnostics; and (v) procurements conducted under the Public Procurement (Preference to Make in India) Order 2017 or any other order issued by the Central Government.
The Government of India expects that as a result of this two-way tariff liberalisation, trade between the two countries would increase to $100 billion in the next five years, up from $68.4 billion in 2021. Sectors that are likely to benefit from UAE’s tariff cuts are gems and jewellery, textiles, leather, footwear, sports goods, plastics, furniture, agricultural and wood products, engineering products, pharmaceuticals, medical devices, and automobiles. Currently, almost two-thirds of India’s exports to the UAE comprise of petroleum products, gems and jewellery, apparels, iron and steel, and their products, and telecom equipment. Each of these products has a share in exports of more than 5 percent. It is therefore interesting to note that the government is expecting a sizeable change in India’s export basket following the implementation of the CEPA.
How realistic are these expectations that UAE’s tariff elimination would result in much higher exports? It may be argued that the realisation of the government’s expectations would be a function of two factors, one the preference margins that Indian products would enjoy when the CEPA is implemented, and two, how effectively regulatory barriers are dealt with. As regards the preference margin, or the difference between the existing tariffs (the most favoured nation or MFN tariffs) and the preferential tariffs that UAE has offered to India, it may be pointed that this would not be very large. According to the data provided by the WTO on the MFN tariffs maintained by the UAE, 87.2 percent of its tariff lines attract tariffs of 5 percent, while 11.2 percent of the tariff lines are tariff free. The remaining tariff lines either attract 100 percent tariffs, these are mainly tobacco products, or are designated as “special goods” (prohibited goods). This implies that for most products, the preference margins would be no more than 5 percent. Moreover, UAE has already eliminated tariffs on most pharmaceutical products on an MFN basis. This, in other words, means that tariff elimination by the UAE is not likely to be a major factor for triggering the increase in India’s exports that the government expects; the key factors could be the regulatory barriers.
(ii) India-Australia Economic Cooperation and Trade Agreement (ECTA)
There is ample evidence that the ECTA could provide the impetus for broadening and deepening India-Australia trade. The commitments taken by the two countries for opening their respective market augurs well for an early the adoption of the full-fledged trade agreement, the CECA. Australia has agreed to eliminate tariffs on 98 percent of its tariff lines when the agreement enters into force, eliminating tariffs on the remaining lines within five years. In contrast, India will eliminate tariffs on 69 percent of its tariff lines, while almost 30 percent of its tariff lines are in the exclusion list. Through these commitments, India will reduce its average tariff rate on Australian imports from 14 percent to about 6 percent when ECTA is fully implemented (Department of Commerce 2022d).
Though India’s tariff offers look conservative, it has agreed to provide significant market access by agreeing to immediately eliminate tariffs on 85 per cent of its imports from Australia. This is commercially significant for Australia as its exports to India in 2021 were over $15 billion. This figure would increase with India’s commitments to eliminate tariffs on several products of export interest to Australia, including sheep meat, wool, fresh rock lobsters, metallic ores such as manganese, copper, and zirconium, besides coal, alumina, titanium dioxide, certain critical minerals, and certain non-ferrous metals. Imports of barley, oats, hides and skins and LNG will remain duty-free as they have been in the past. India will immediately provide duty free quota for facilitating cotton imports, and has agreed to slash tariffs on lentils, almonds, oranges, mandarins, and pears. Despite these offers, India’s current set of market access commitments have not met the expectations of some of Australia’s major export sectors, which have often been articulated by Dairy Australia and Grain Trade Australia.
India expects its bilateral trade with Australia to double within five years. This could happen if India is able to expand its exports of pharmaceuticals and textiles and garments, areas in which it has proven competitive edge, and in electronics products, like mobile phones, which have lately seen robust increase in exports from India. Trade in pharmaceutical sector could benefit from the decision taken as a part of the ECTA that drug regulators in both countries, the Therapeutic Goods Administration of Australia and India’s Central Drugs Standard Control Organisation, will work in close coordination to “facilitate trade in human prescription medicines and medical devices”.
IV. Conclusions
Over the past two decades, India has been actively engaged in formalising FTAs, including with some of its major partners in the East Asian region, the European Union and, more recently, with the United Kingdom. While negotiations with its European partners are still ongoing, India has fully implemented its FTAs with the ASEAN, the Republic of Korea (RoK), and Japan. These FTAs are bound by a common set of aspirations of strengthening mutual economic relations through enhanced trade and investment.
Much is expected from opening of markets through lowering/eliminating tariffs, especially through larger participation in production networks, paving the way enhancing the competitiveness of the participating countries’ enterprises. These objectives should be realised through larger two-way trade flows and improved trade in technologically sophisticated products.
If these parameters are used to assess the outcomes of India’s FTAs, the unambiguous conclusion that can be arrived at based on the analysis provided in this paper is that these FTAs have not been beneficial to India. In each of the three agreements that have been fully implemented, India’s trade deficit has increased, especially because of the inability of India’s manufacturing industries to increase their presence in the partner countries’ markets.
Further, threat of competitive pressures from several potential partner countries participating in the Mega Regional Agreement, the Regional Comprehensive Economic Partnership, led to India’s withdrawal from this agreement. China was one of the major factors, but the presence of Australia and New Zealand, two of the more competitive producers agricultural and dairy products, respectively, was yet another factor.
This leads to the argument that the lack of competitiveness of Indian industry, and an absence of a coherent strategy to participate in the international division of labour, has been a major factor preventing India from taking advantage of the relatively open markets resulting from the FTAs. More than four decades of experience with globalisation has proved beyond an iota of doubt that adhering to the logic that countries must liberalise their economies and allow the market forces to determine their comparative advantage, has not benefited any major economy. A country needs follow what Ha Joon Chang had argued, “to defy its comparative advantage in order to upgrade its industry”, and to do so it requires a well-honed industrial policy that has long been followed by the successful industrialisers in East and South East Asian region.
Our view is that India’s inability to develop an industrial policy to upgrade its industrial sector and the absence of coherent policy framework to make the agricultural sector more competitive, lies at the heart of its failure to benefit from the FTAs. Past FTAs have not delivered, and there is even less possibility that any of the future FTAs would.
Annex Tables


Notes
[1] Bangladesh, India, the Lao People’s Democratic, the Republic of Korea and Sri Lanka were the five original signatories to the agreement. China acceded to the Agreement in 2001.
[2] This paper will be using the term FTAs, although the term was used in the describe agreements that included issues only relating to trade in goods and services. In recent decades, most of the bilateral/regional trade agreements have not only mirrored the WTO in terms of the subject matter that are included, but several of these agreements have also included subjects that WTO does not deal with, e.g., labour, and environmental standards. These broad-based agreements that India has signed are generally known as comprehensive economic partnership/cooperation agreements (CEPAs/CECAs), we shall appropriately use these terms in this paper.
[3] China, Japan, RoK, Australia, New Zealand, and India.
[4] Calculations of the author using data from Ministry of Foreign Affairs 2011.
[5] Author’s calculations using data from ASEANStatsDataPortal (https://data.aseanstats.org/).
[6] Aircraft and spacecraft, computers and office machines, electronics-telecommunications, pharmaceuticals, scientific instruments, electrical machinery, inorganic chemicals, non-electrical machinery, and armament (Eurostat 2022).
[7] Author’s calculations using data from Korea Customs Service (https://unipass.customs.go.kr/ets/index_eng.do).
[8] Author’s calculations using data from DGCIS, Department of Commerce.
[9] Tariffs applied on all countries other than those with which India had FTAs.
[10] Government of India. 2018. Budget 2018-2019: Speech of Arun Jaitley, Minister of Finance. 1 February; paragraph 160.
[11] Government of India. 2019. Budget 2019-2020: Speech of Nirmala Sitharaman, Minister of Finance, July 5; paragraph 135.
[12] SIAM. 2019. White Paper: Trade Agreements that may Jeopardize “Make in India” Programme for Automobiles. June.
[13] Government of India. 2018. Agricultural Statistics at a Glance 2017. accessed from: https://agricoop.gov.in/sites/default/files/agristatglance2017.pdf; Table 15.2(a).
[14] For instance, the government has regularly imposed high import duties to protect the domestic wheat producers against imports. The most recent occurrence of this phenomenon was in April 2019, when import duties were increased from 30% to 40%. See, Reuters 2019.
[15] The subsequent account is based on Dhar and Rao 2020.
References
Ajayan. 2009. Kerala parties fear cheaper cash crops may disrupt local supply. Mint. 25 Aug, accessed from: https://www.livemint.com/Politics/OOBwEyB2Kqa8aRMutpdujL/Kerala-parties-fear-cheaper-cash-crops-may-disrupt-local-sup.html.
ASEAN. 2003. Framework Agreement on Comprehensive Economic Cooperation Between the Republic of India and the Association of Southeast Asian Nations, Bali. 8 October, accessed from: https://asean.org/framework-agreement-on-comprehensive-economic-cooperation-between-the-republic-of-india-and-the-association-of-southeast-asian-nations-bali/.
Dhar, Biswajit and KS Chalapati Rao. 2020. India’s Economic Dependence on China. The India Forum. July 23, accessed from: https://www.theindiaforum.in/article/india-s-dependence-china.
Dhar, Biswajit. 2019. India’s Withdrawal from the Regional Comprehensive Economic Partnership. Economic and Political Weekly. November 16.
European Commission. 2022. EU and India kick-start ambitious trade agenda. Directorate-General for Trade. 17 June, accessed from: https://policy.trade.ec.europa.eu/news/eu-and-india-kick-start-ambitious-trade-agenda-2022-06-17_en.
Eurostat. 2022. International trade and production of high-tech products. 26 September, accessed from: https://ec.europa.eu/eurostat/statistics-explained/index.php?title=International_trade_and_production_of_high-tech_products.
Ghosh, Kamalika. 2019. India opted out of RCEP to protect domestic industry from cheap imports: Piyush Goyal. MoneyControl, accessed from: https://www.moneycontrol.com/news/economy/policy/india-opted-out-of-rcep-to-protect-domestic-industry-from-cheap-imports-piyush-goyal-4607151.html.
Laskar, Rezaul H. 2019. RCEP trade deal a no-go, PM Modi says conscience doesn’t allow. Hindustan Times. 5 November, accessed from: https://www.hindustantimes.com/india-news/neither-gandhi-s-talisman-nor-my-conscience-allows-to-join-rcep-pm-modi/story-MwoYlJchVp3S1OK1EKilHK.html.
JETRO. 2022. Japanese Trade and Investment Statistics, accessed from: https://www.jetro.go.jp/en/reports/statistics.html.
Lin, Justin and Ha-Joon Chang. 2009. Should Industrial Policy in Developing Countries Conform to Comparative Advantage or Defy it? A Debate Between Justin Lin and Ha-Joon Chang. Development Policy Review. Volume 27, Issue 5. September 2009. pages 483-502.
Ministry of Commerce and Industry. 2009a. Comprehensive Economic Partnership Agreement between India and Korea. 9 August, accessed from: https://commerce.gov.in/wp-content/uploads/2020/05/INDIA-KOREA-CEPA-2009.pdf.
Ministry of Commerce & Industry. 2009b. Trade in Goods Agreement under the Framework Agreement on Comprehensive Economic Cooperation between the Republic of India and the Association of Southeast Asian Nation – Schedules of Tariff Commitments. 13 August, accessed from: https://commerce.gov.in/international-trade/trade-agreements/india-asean-agreements/.
Ministry of Commerce & Industry. 2015. Inputs on Initial Offer of Goods under Regional Comprehensive Economic Partnership (RCEP), accessed from: https://tinyurl.com/ycywd6va.
Ministry of Commerce & Industry. 2021. Commerce Minister – “We Can Sort Out FTAs Fairly Quickly, If The Areas Where We Have The Ability To Compete Internationally Can Be Identified”. 19 August, accessed from: https://pib.gov.in/PressReleasePage.aspx?PRID=1747398.
Ministry of Commerce and Industry. 2021. Status of Free Trade Agreements, 17 December, accessed from: https://pib.gov.in/PressReleasePage.aspx?PRID=1782687.
Ministry of Commerce and Industry. 2022a. Trade Agreements. 3 November, accessed from: https://commerce.gov.in/international-trade/trade-agreements/.
Ministry of Commerce and Industry. 2022b. UAE and India Sign Historic Trade Pact, Marking a New Era of Economic Cooperation. 18 February, accessed from: https://pib.gov.in/PressReleseDetailm.aspx?PRID=1799435.
Ministry of Commerce and Industry. 2022c. Comprehensive Economic Partnership Agreement (CEPA) between the Government of the Republic of India and the Government of the United Arab Emirates (UAE). 27 March, accessed from: https://commerce.gov.in/international-trade/trade-agreements/comprehensive-economic-partnership-agreement-between-the-government-of-the-republic-of-india-and-the-government-of-the-united-arab-emirates-uae/.
Ministry of Commerce and Industry. 2022d. India-Australia Economic Cooperation and Trade Agreement (INDAUS ECTA) between the Government of the Republic of India and the Government of Australia. 30 June, accessed from: https://commerce.gov.in/international-trade/trade-agreements/ind-aus-ecta/.
Ministry of Foreign Affairs. 2011. Comprehensive Economic Partnership Agreement between Japan and the Republic of India. Government of Japan. 16 February, accessed from: https://www.mofa.go.jp/region/asia-paci/india/epa201102/pdfs/ijcepa_ba_e.pdf.
Reuters. 2019. Govt hikes wheat import duty to 40% to support local farmers. Business Today. April 27, accessed from: https://www.businesstoday.in/current/economy-politics/wheat-import-duty-farmers-flour-mills-agriculture-indian-farmers-agarian-sector-agricultural-sector/story/341030.html.
WTO. 2003. Discussion Paper on Regional Trading Arrangements: Communication from India. TN/RL/W/114. 6 June.
WTO. 2020. World Tariff Profiles, accessed from: https://www.wto.org/english/res_e/publications_e/world_tariff_profiles20_e.htm.
Biswajit Dhar is a Professor of Economics at the Centre for Economic Studies and Planning, School of Social Sciences, Jawaharlal Nehru University, New Delhi. This paper was presented at the Conference on Indian Economy organised by the Centre for Development Studies, Thiruvananthapuram, on November 28-30, 2022.
Image courtesy of 123rf.com